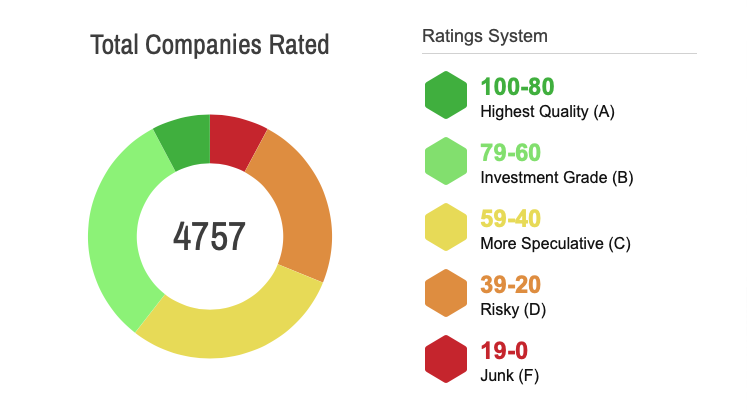
This section allows you to view how Stansberry ranks the market’s top companies. Companies that meet the requirements receive a Stansberry Score. The Stansberry Score offers a unified view of a company’s overall financial health based on four proprietary indicators: Capital Efficiency, Valuation, Financial, and Momentum. The Stansberry Score is available for all major U.S. exchanges and is updated daily.
Please note: The Stansberry Score is only available to The Quant Portfolio subscribers and Alliance Members.
It should be noted, that not every company will have a Stansberry Score. Companies need to meet the testing criteria of each Stansberry Indicator in order to receive a Stansberry Score. Subsequently, not every company will have scores from each of the indicators. Our four proprietary indicators have specific testing criteria, all of which differ and must be met in order to receive a score.
Capital Efficiency tells you whether a business is increasing sales, generating cash flow, offering high returns on assets, and rewarding its shareholders. We assign all U.S. listed companies a score that helps you quickly determine whether a company is profitable. A higher score means a more capital-efficient company, with a score of 80 or higher being very good and a score of 50 being average.
Valuation uses an unbiased system to determine if the company is trading at a good valuation. Our system simply estimates future free cash flows that the company will generate, then it discounts them back to the present. We rank each stock’s potential upside based on current prices. This system consistently scores and compares thousands of stocks each day. Scoring in the bottom 70% of this indicator is a considerable danger sign.
Our Financial Indicator uses a two-in-one model approach to determine the financial health and risk that a company is experiencing. This indicator not only shows the financial health of a company but also predicts whether a company will default on its debt within the next year. A higher score means a more financially sound company, with a score above 80 being ideal and a score of 50 being considered neutral.
The Momentum Indicator shows whether a stock is rising or falling and whether a stock’s growth is supportable. We calculate each stock’s momentum value and feed this into an algorithm.
