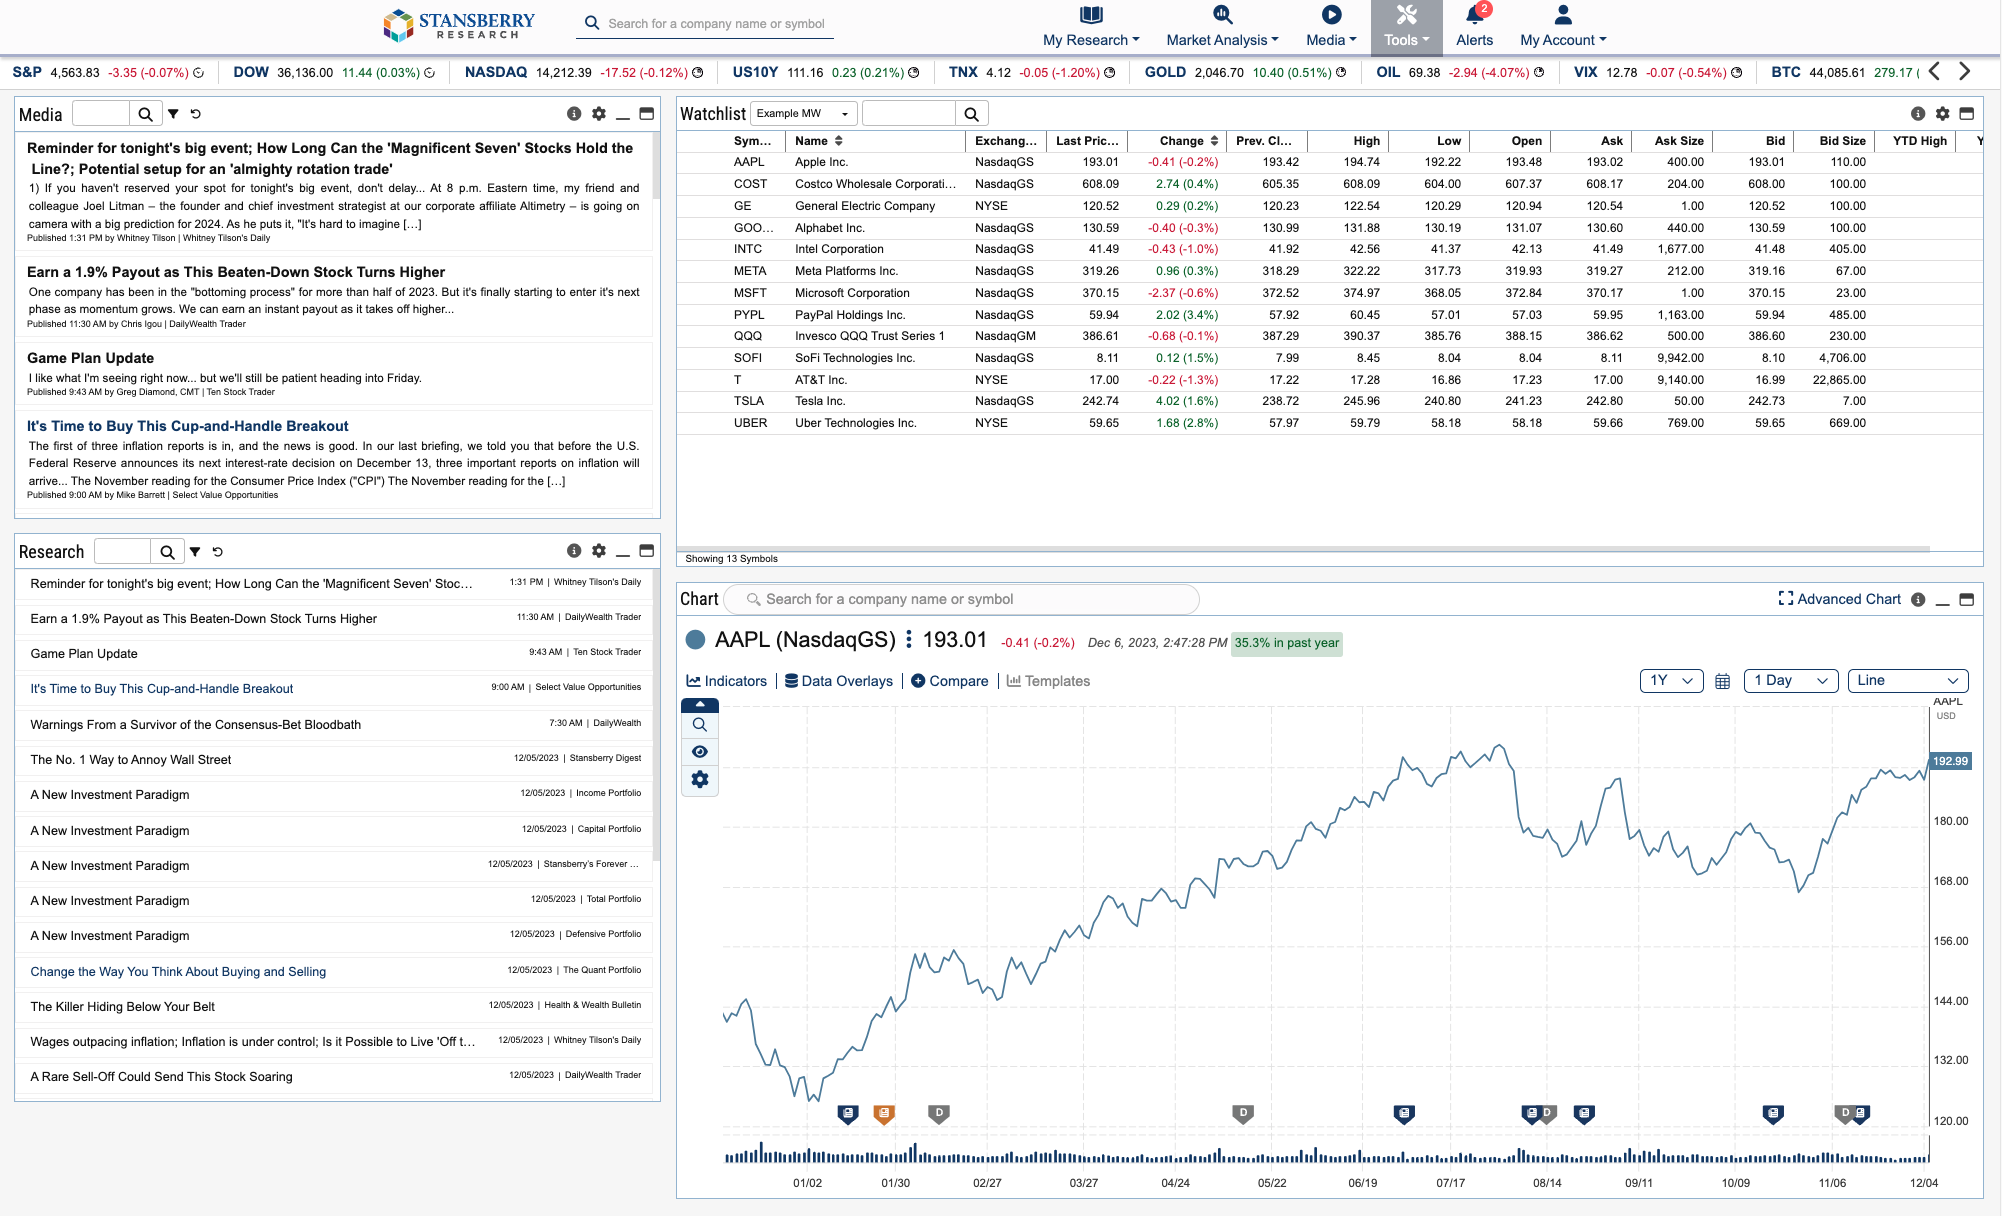
Located under the tools tab, the Dashboard is the only page within StansberryResearch.com that is completely customizable. Using this page, you can create a view that’s entirely yours by simply adding or moving widgets, creating numerous watchlists, adding charts, and much more.
The Dashboard comes preconfigured to help you understand its full capabilities. The default can be seen below and includes the following widgets: Research, Watchlist, Media, and a Chart. Each widget can be minimized and maximized. You can also customize your view to show your content as compact or paragraph.

The Research Widget streams the 25 most recent articles to which you subscribe. You can filter by editor or publication by clicking the filter icon, or you can use the Search box to look up a specific company. When using filters on these widgets, it is important to note that they will save between sessions, meaning if you filter by Stansberry’s Investment Advisory that filter will remain until you clear it. If you’d like to rename a widget dedicated to particular publications and/or editors, please refer to the Preferences section of this manual.
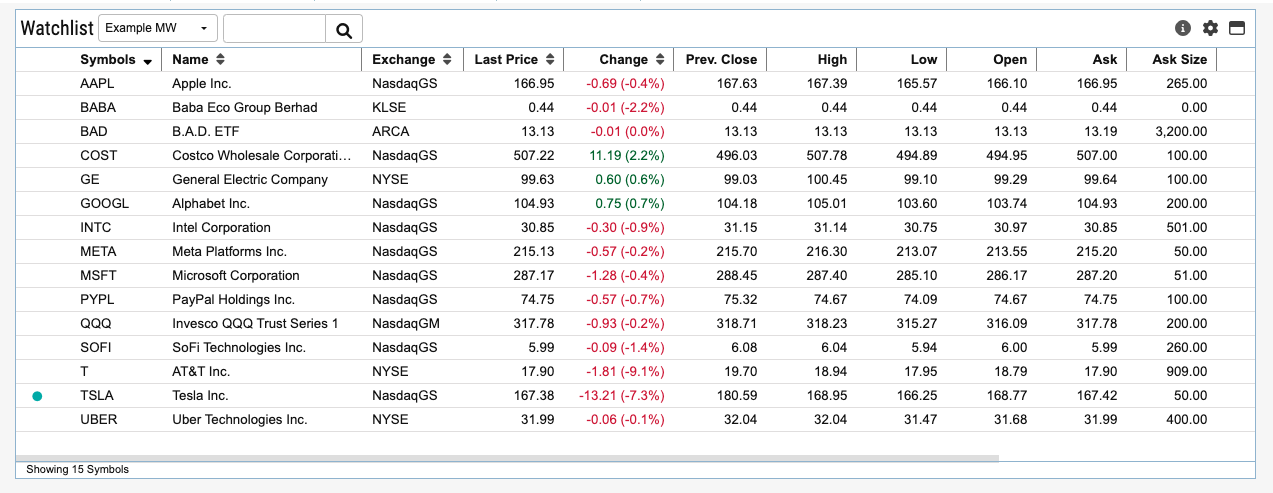
The Watchlist Widget allows you to create a custom watchlist of companies you’re interested in. Users can import a portfolio from most of your subscribed publications into this widget, and they can also be used in your ticker tape, which appears at either the top or bottom of the platform. Please note: Not all of our Stansberry Research publications support Watchlist importation.

In addition to this default view, we customized a watchlist and the indices for you, titled Example MW. If you would like to edit these positions, you are able to delete them entirely or you can add your own watchlist by clicking the watchlist name and entering a new name. From there, all you need to do is use the search bar to the right to add securities. Additionally, you can customize the columns that are shown in your Dashboard Watchlist by clicking on the settings wheel within the widget. You cannot add custom columns, but you can remove columns from your default view.
Lastly, the Watchlist also supports Auto Search, which if enabled will filter your media feeds based on your selection. If you choose “By Symbol,” simply click on a ticker symbol in your watchlist, and your Research and Media feeds will filter for content related to that company. Similarly, “By Watchlist” will filter the media widgets based on all of your ticker symbols within that list.
At the top of the Dashboard, we offer various indices to keep you up to date. Our default indices preferences include S&P, DOW, NASDAQ, GOLD, OIL, and BTC. S&P, DOW, and BTC all stream in real-time when the market is open. All other indices are 15 minutes delayed. If you would like to edit any of these please reference the Preferences section of this manual.
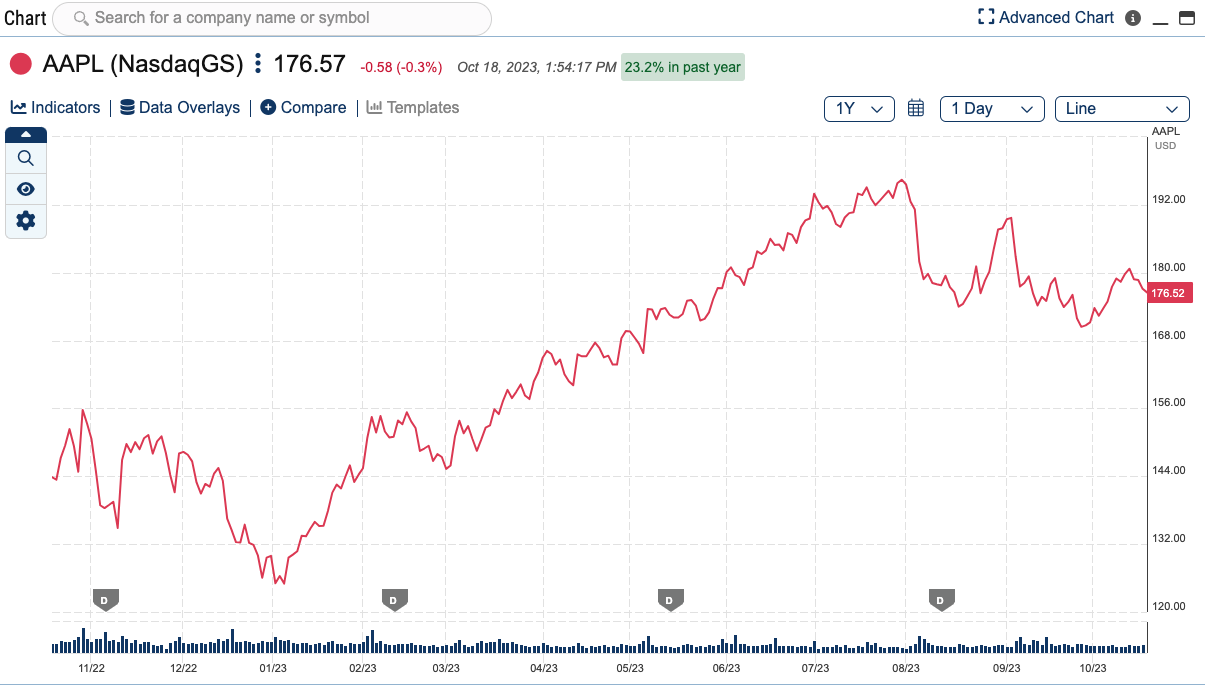
Additionally, the Dashboard includes a Chart widget that allows you to search for stocks as well as macroeconomic data such as Commitment of Traders, U.S. Treasuries, housing, and much more. Our charting feature allows you to compare up to 12 items at a time, ranging from Indicators to Data Overlays, as well as companies. The Dashboard Chart can be minimized, maximized, resized or even moved around to your desired location.
To learn more about our Chart, please refer to the Chart section of this manual or visit the FAQ which is available in any advanced chart.
