The My Portfolios section allows you to upload your personal portfolios for tracking and analysis. You can manually create your portfolio or import a portfolio from your broker. To use this feature, simply click “Add Portfolio.” From there, you will be able to choose “Create Portfolio,” “Import Portfolio from Broker site,” or “Upload a CSV Spreadsheet.”
When choosing to manually create your portfolio, you will be prompted to name the portfolio, specify the currency, and add positions. You will be able to search and add ticker symbols, specify the transaction type, and list the date of purchase, price, and number of shares. You can add a cash position as well. Once all your positions are added, click “Done” to save the Portfolio. It should be noted, that if you enter a position, the most recent price will be pulled automatically, please double check your dates and prices match your personal portfolio.
If you prefer to Import a Portfolio from your Broker, you can select that option, which will connect you to Plaid. From there, a pop-up window will appear explaining the process. Stansberry Research uses Plaid to connect to your brokerage account. Plaid is a third-party service that creates a secure connection to more than 2,000 financial institutions. If you’ve opted to sync your portfolio from your broker, please note that there are some delays that vary from broker to broker. To learn more about Plaid, visit the Connect Brokerage Account article in this Help Center.
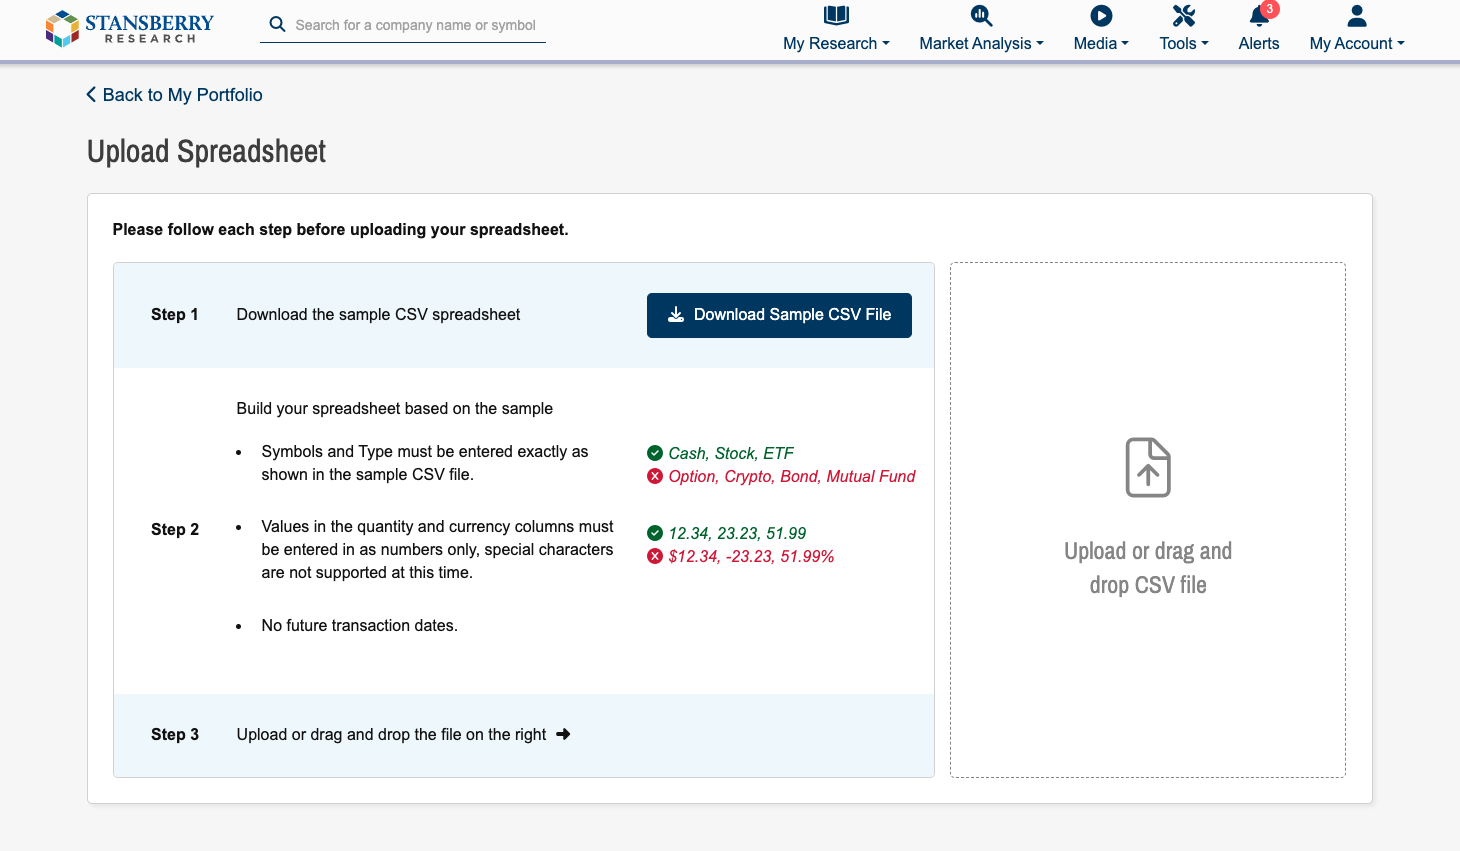
Additionally, you are able to upload your portfolio with a CSV file. To begin this process, you first need to click the link to download our sample CSV file. Once you open our sample spreadsheet, fill in the rows with the information specific to your portfolio and delete our sample data. Save that spreadsheet to your computer. From there, you can upload that file to our website by clicking the “Upload” button or dragging the file to the drop box from a local folder.

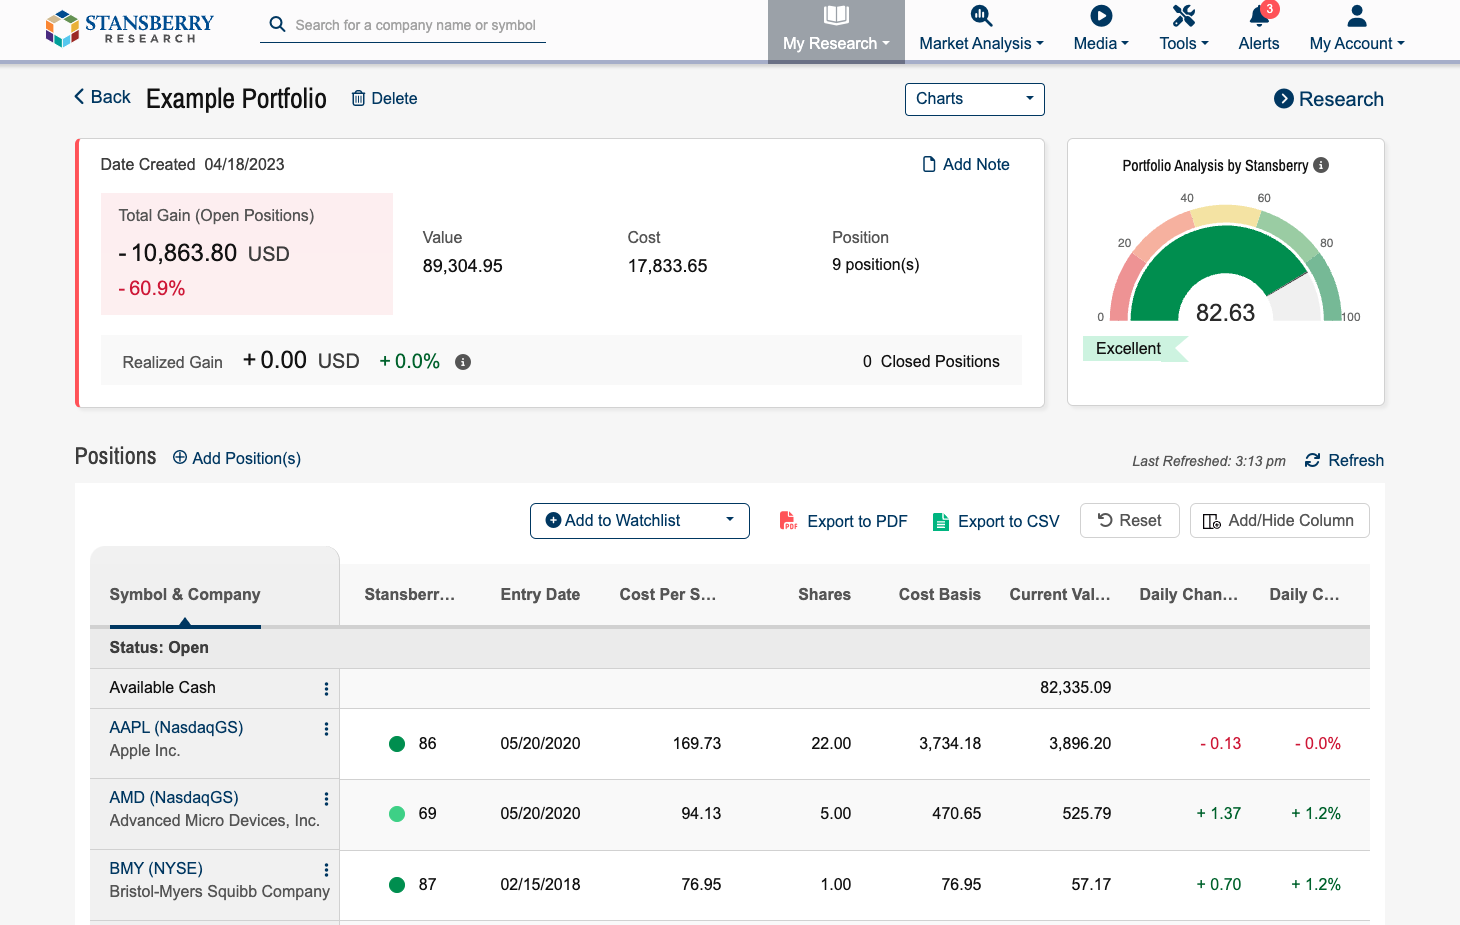
Once your portfolio is connected or uploaded, you will be able to view a Portfolio Analysis by Stansberry. The Portfolio Analysis score uses our proprietary Stansberry Score and the weights of the securities within your portfolio to generate a unique weighted average Stansberry Score. This score reflects the overall health of your portfolio based on Capital Efficiency, Momentum, Financial, and Valuation metrics. To learn more about each individual metric, visit the Stansberry Score page. You will also be able to view a table that displays your positions and all the associated data.

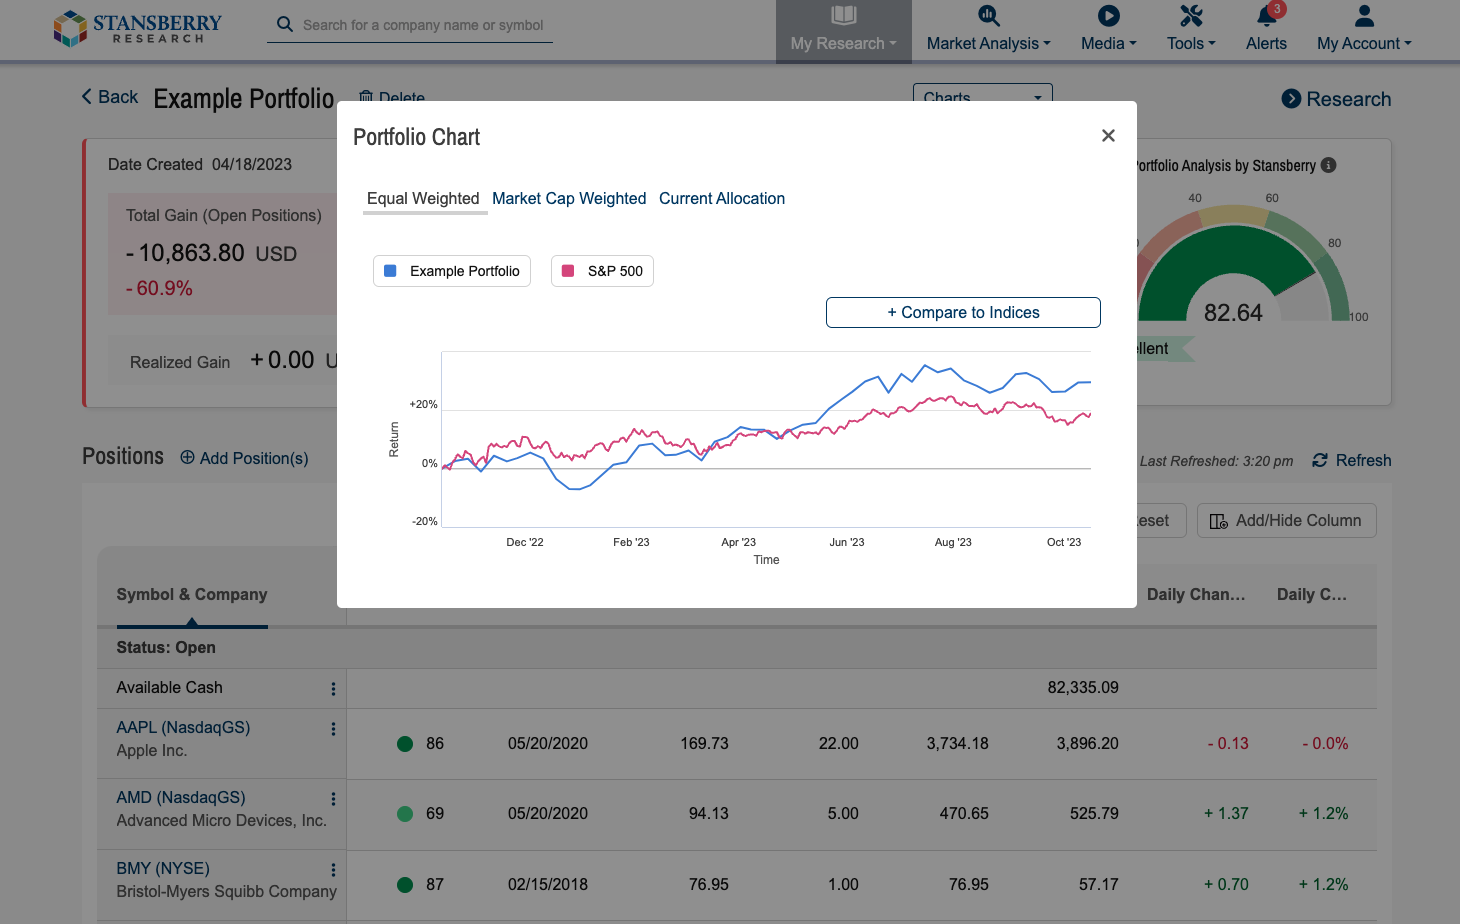
You can also view various charts to see how your portfolio is performing. Click “Charts” in the dropdown, and choose your desired chart type (Equal Weighted, Current Allocation, and Market Cap Weighted). You can also compare your portfolio to various indices, such as S&P 500 seen below.
