Companies & Funds

Written by Stansberry Research
Updated at April 12th, 2024
The Companies & Funds tab allows you to search for and view details about specific companies or funds. You can access this page by using the Global Search and selecting the company from the dropdown, or you can click Market Analysis > Companies & Funds to begin searching for a company or fund.
To use this page, simply search for a ticker symbol and click on the result in the dropdown. If you click enter on your keyboard, you will be redirected to our Search Results page, where you can click on the ticker symbol to be redirected to the Company page.
The Companies & Funds page offers a plethora of information for that particular equity. On this page, you can see a description or company bullets written by Stansberry Research, Top Research, Trading Statistics, a chart, and much more.
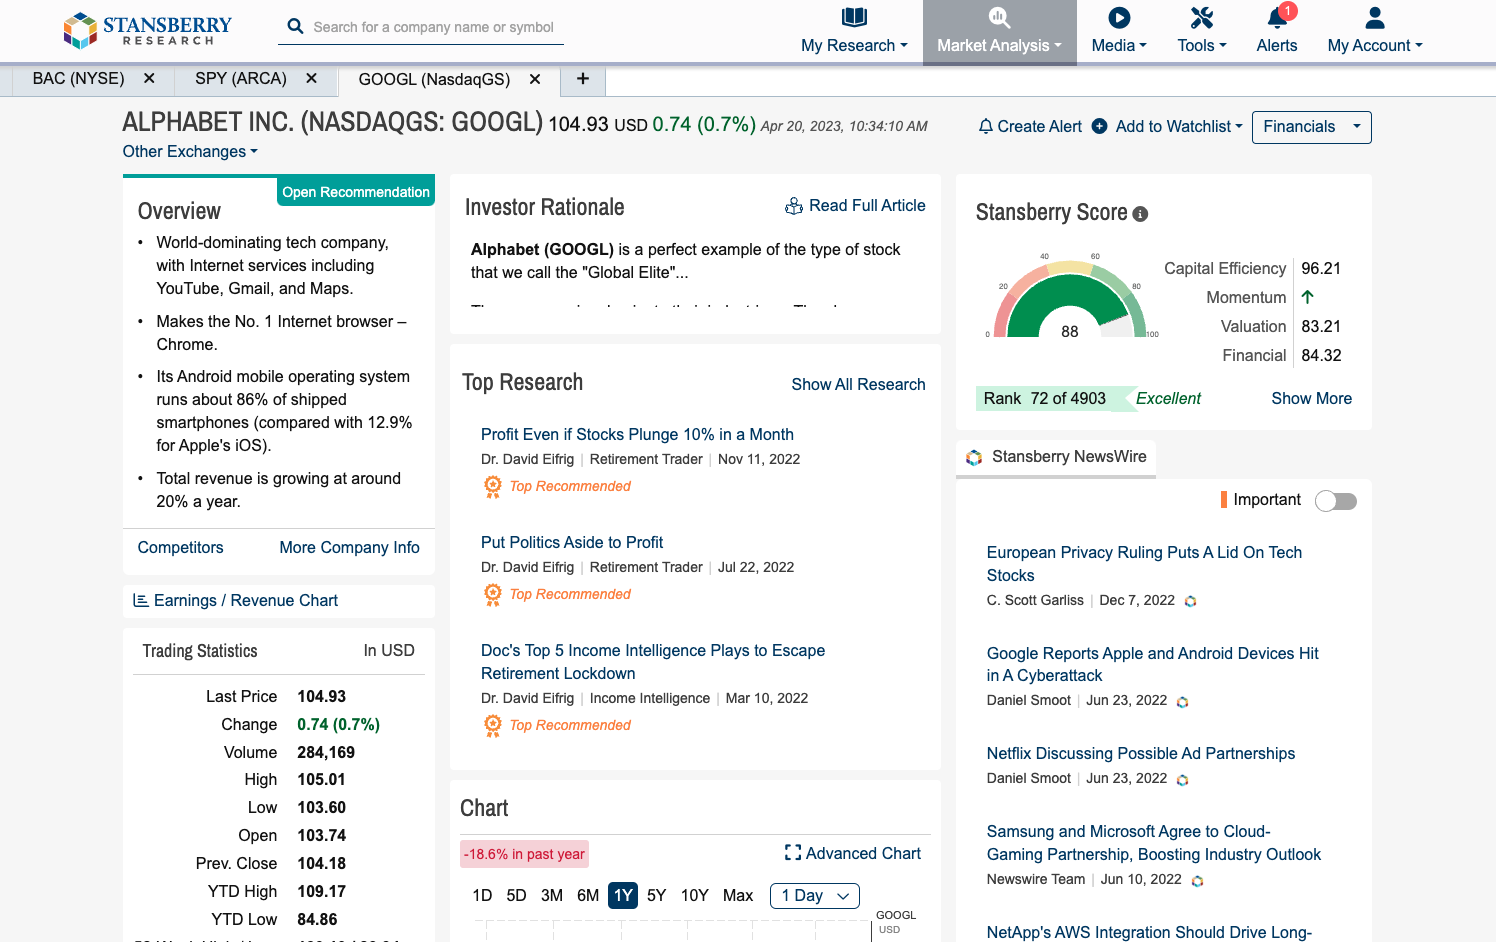
Starting at the top of the page, you can see the company name and current price. You can also add that particular company to your Watchlist, create an alert, or view the company’s financials.
Moving down the page, you’ll see either an overview of the company with bullets written by Stansberry Research, or a full description of the company from S&P. If a company is currently recommended in one of your portfolios, you will see the “Open Recommendations” tag. If clicked, you’ll be redirected to the Portfolios section of this page. The Portfolios section will show you what portfolios have an open recommendation for that company.
Our Investor Rationale is written by our Investment Committee and contains a brief write-up for a specific company. The Investor Rationale will not always appear, it will only be available if the company is an open recommendation. Directly below the Investor Rationale, you will see Top Research. These articles have been deemed by our Investment Committee to be the best articles we’ve written to date on a particular equity.
The Company page also features Earnings and Revenues charts, Competitor information, Trading Statistics, and a SnapShot, both of which highlight some of the most important statistics you need to know as an investor.
We also highlight our proprietary Stansberry Score on the Company page. Located in the top right-hand corner, the Stansberry Score highlights the company’s health and includes a score for each of the indicators that make up the composite score. If you’d like to learn more about that particular score, simply click Show More to read a full breakdown of the Stansberry Score.
The Company page also highlights some of our world-class research. Here, you’ll see three suggested articles for your viewing pleasure.
Lastly, the Company page includes a mini-chart that features Stansberry Indicator Flags, Dividend Flags, and more. If you want to learn more about our charts, please visit the Chart section of this user manual.